
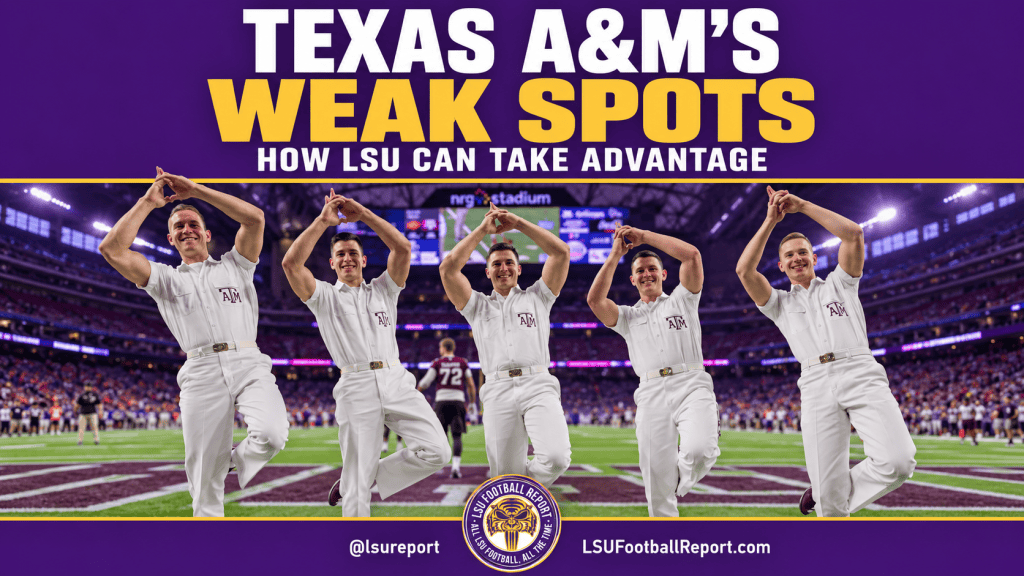
Texas A&M’s early statistics reveal several openings LSU should be eager to test. The Aggies rank last in the SEC in completion percentage, yards per pass attempt and sacks, while their overall offensive efficiency sits near the bottom of the conference.
Those weaknesses point toward a practical approach for the Tigers: force difficult passing situations on defense, protect the quarterback on offense and make A&M defend sustained possessions.
All statistics below cover games through September 19, 2026. Rankings compare the SEC’s 16 teams across all games, without adjustments for opponent strength.
A Passing Game Struggling for Consistency
A&M’s clearest offensive vulnerability is its production through the air:
- Completion percentage: 58.9%, 16th in the SEC.
- Yards per pass attempt: 6.0, 16th in the SEC.
- Passing yards per game: 222.7, 14th in the SEC.
The Aggies have completed 66 of 112 passes for 668 yards. They are throwing often enough to generate more production, but their combination of incomplete passes and limited yardage per attempt has held them back.
For LSU, the opportunity begins before third down. Containing the run on early downs would force A&M to lean on a passing game that has struggled statistically compared with its conference peers.
That does not mean the Tigers should blitz recklessly. Disciplined rush lanes, sound coverage and reliable tackling would make the Aggies earn their way downfield without giving them easy escape routes.
Last in the SEC in Sacks
A&M has recorded four sacks in three games, averaging 1.33 per contest. Both figures rank last in the conference.
LSU has produced 14 sacks, averaging a conference-leading 4.67 per game. That is a substantial difference in how often the two defenses have finished passing plays behind the line.
For the Tigers’ offense, the potential benefit is time to work through progressions and allow routes to develop. LSU still must identify pressure and execute its protection assignments; sack totals alone do not measure every hurried throw or disrupted play.
Tied for the Fewest Tackles for Loss
A&M’s limited production behind the line extends beyond quarterback sacks:
- Total tackles for loss: 14, tied for 15th and the fewest in the SEC.
- Tackles for loss per game: 4.67.
- LSU’s total: 26, tied for the conference lead.
Kentucky shares A&M’s position at the bottom. Sacks are included in tackles for loss, so the two categories overlap.
The opportunity for LSU is to stay ahead of the chains. Avoiding losses preserves the option to run or pass, making it harder for a defense to anticipate the next call.
Offensive Efficiency Ranks Near the Bottom
A&M averages 5.17 yards per offensive play, ranking 15th in the SEC. Its 394.3 total yards per game rank 12th.
The Aggies have generated 1,183 yards on 229 plays. That efficiency figure matters because it measures production relative to opportunities, rather than simply rewarding an offense for running more plays.
LSU’s defensive goal should be to make A&M sustain drives. Limiting explosive gains and tackling promptly would force the Aggies to execute repeatedly instead of escaping a difficult possession with one long play.
The Pass Defense Has an Opening, Too
A&M allows 178.7 passing yards per game, tied for sixth in the SEC. However, opponents have attempted only 23 passes per game against the Aggies.
On a per-attempt basis, the picture changes:
- Passing yards allowed per attempt: 7.8, ranking 14th in the SEC.
- Opponent passing totals: 536 yards on 69 attempts.
The relatively low passing-yardage average partly reflects limited passing volume. When opponents have thrown, their average gain has been comparatively high.
For LSU, that supports testing coverage with a varied passing attack. Taking available completions and selecting deeper opportunities carefully would offer a sensible way to challenge that weakness.
A Limited Kickoff Return Threat So Far
The Aggies average 14.33 yards per kickoff return, ranking 15th in the SEC. That figure comes from three returns for 43 yards.
Three opportunities are too few to establish a dependable trend. LSU should treat the ranking as background information while maintaining disciplined coverage.
Where LSU Should Focus
A&M’s defensive weaknesses should not be confused with an inability to stop the run or get off the field. The Aggies have allowed 3.5 yards per rushing attempt and held opponents to seven conversions on 31 third-down attempts.
The strongest statistical case for LSU centers on passing efficiency and avoiding negative plays. Make A&M throw in difficult situations, protect LSU’s quarterback and take advantage of favorable coverage matchups. Those priorities target identifiable weaknesses while respecting the areas where the Aggies have performed well.
Sources
Statistics checked September 23, 2026; reporting period through September 19.
- CFBStats, SEC Passing Offense: completion percentage, yards per attempt and passing yards per game.
- CFBStats, SEC Sacks and Tackles for Loss: Texas A&M and LSU totals and conference positions.
- CFBStats, SEC Total Offense: yards per play, total yardage and yards per game.
- CFBStats, SEC Passing Defense: opponent passing totals and yards allowed per attempt.
- CFBStats, SEC Kickoff Returns and Texas A&M Team Statistics: return production, rushing defense and third-down defense.

